KNOWN KNOWNS
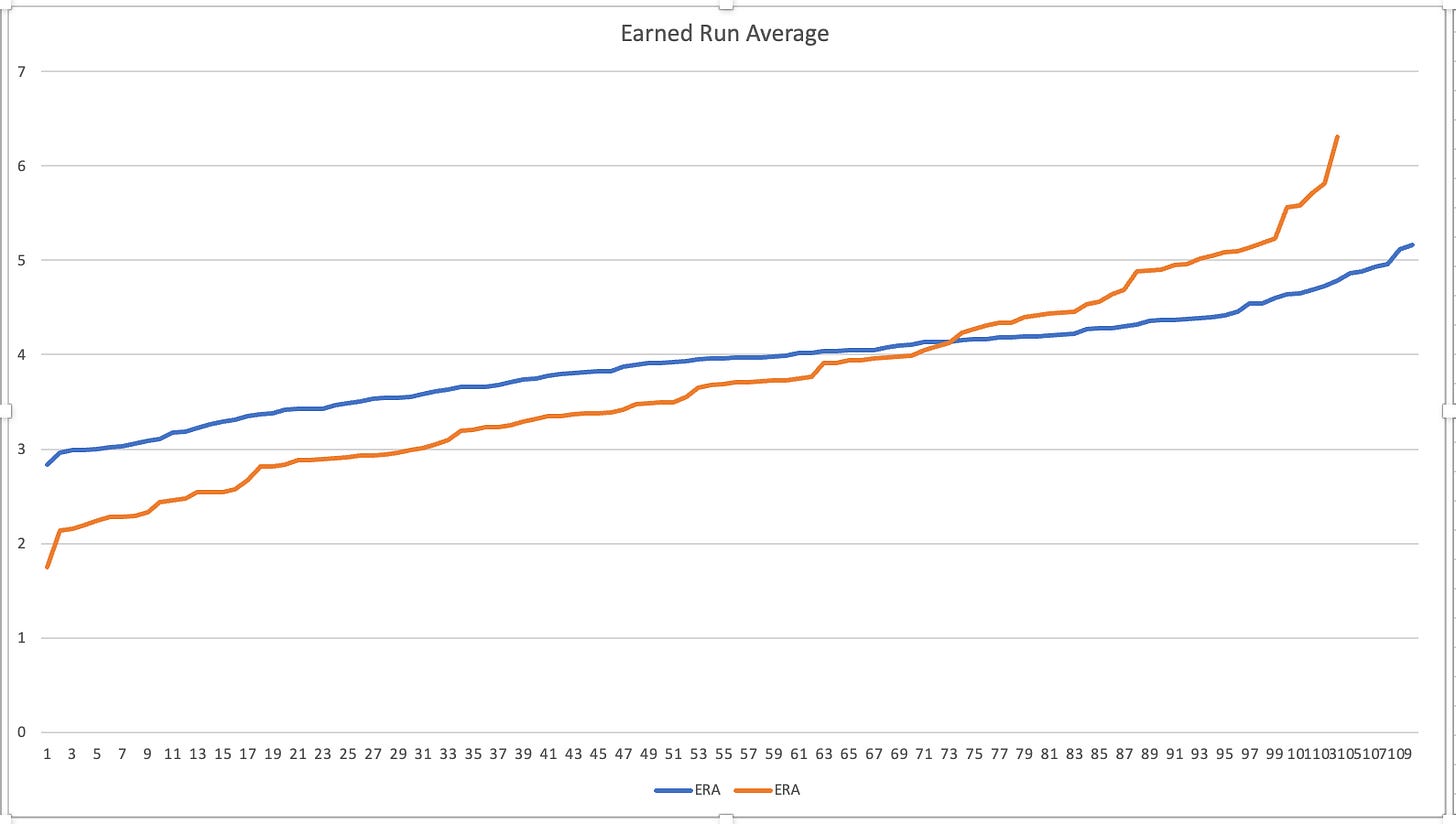
The blue line represents the projected ZIPS ERA for all pitchers projected to throw more than 125 innings this year. There are 111 of them
The red line represents the actual 2022 ERAs for all pitchers who threw 120 innings last year. There were 104 of them.
Each line is sorted ascending.
It may not be a surprise to you that the angles of the two lines differ, but that’s probably because you play fantasy baseball and know that player projections generally regress previous outcomes to some kind of mean. No one projects Aaron Judge to hit 62 homers in any given year. No one projects a pitcher these days to win 20 games. But Judge did and each year a pitcher or two might. Last year it was Kyle Wright.
But it isn’t just regression to the mean at work in the Earned Run Chart.
Keep reading with a 7-day free trial
Subscribe to Rotoman's Guide to keep reading this post and get 7 days of free access to the full post archives.


