


WHERE WE’RE AT
I’ve had a lot of questions about the printed-on-demand Guide, which is coming very soon.
I’m currently making final tweaks on prices. I’m nearly done with the projections. There are a lot of profiles written. Some I fear aren’t entirely elegant and there are typos, but I hope to clean that all up before it goes to print.
I have a little work to do on the cover, too, and thanks for all your comments about that.
What is being offered, many of you have asked:
There will be a PDF version of the Rotoman’s Fantasy Baseball Guide 2024, the A-Z section of the old magazines, alas without Picks and Pans, which all paid-up “Annual” subscribers will receive as part of their subscription. That will also be available as a separate purchase.
There will also be a Print-on-Demand version that will cost more, just because the POD and mailing process is costly.
There may be a Kindle version, though the charts don’t seem well suited to the Kindle experience.
Availability will be announced here as soon as they’re ready.
Thanks for your interest and support. It’s going to be a crazy next few days hurtling toward the next step. There may be a newsletter Friday, but if not I’ll see you on the other side!
Sincerely,

ASK ROTOMAN
Rotoman:
Would there be time for a post about keeper leagues? And how to deal with inflation? I've started to compare my leagues from last year, looking at the calculated inflation I had going into the draft and the actual inflation. From what I've found for hitters, the top 20-25 guys all go for the inflated value, but then in the middle and lower tiers ($15 and below) there was basically no inflation. So there could be bargains to be had among hitters in that range of players.
For Pitchers, the inflation seemed to be spread pretty evenly. Each pitcher went for about 30 percent more than the non-keeper league bid values.
I'm going to go back two years and do the same calculation. But according to these observations I shouldn't buy any of the premium hitters and pay a 30-percent premium when I can sit back and buy more $10-15 hitters at value (or sometimes even below). But that effectively locks me out of the top players. I’m interested to hear others’ thoughts. Thanks.
Sincerely,
Deficit Hawk
Dear Deficit Hawk:
Let me start by describing the issue, even though you clearly understand it, for those who don’t.
Draft inflation occurs in keeper fantasy leagues because players of value are usually kept (or frozen) for a lower price than they would have been if they were available in the league’s auction.
For example: You paid $20 for Gunnar Henderson last year. You own his blanket. He earned $23, so you made a little profit. You sleep with Gunnar. What would he go for in this year’s auction? I say $26. If you freeze him you’ll have $6 of extra spending capacity. Repeat for however many players your league keeps, add up the discounts and you’ll have an idea of how much extra money will be available to be spent in your auction, which you can use to calculate your inflation rate. You’ll also stay warm.
WONKY DIVERSION AHEAD: How to figure draft inflation

When I first learned of this, back in the 1980s, the procedure was to add up the expected costs of the frozen players and what their actual frozen costs would be.
If you subtracted the actual frozen costs from the total budget (usually $3120 in Rotisserie leagues) you would have how much money will be spent on draft day. Let’s say the frozen players would cost $900. So you’d have $2220 available.Then, if you subtracted the expected costs of the frozen players, their value as it were, from the total budget (again $3120), you’d have how much talent was going to be available. Let’s say the talent was worth $1500. You’re chasing $1620 of talent.Divide the amount of money available by the amount of talent available and you have the Inflation Rate. $2220/$1620 = 1.37 or 37 percent inflation.At first, back in the 1980s, we would apply the inflation rate to all the players available in the pool, but by trial and error, we saw the same thing you did, DH. Inflation doesn’t affect everyone in the draft pool the same.
My observation about what happens to the inflated dollars, however, is a little different than yours. In general, I would say that the inflated dollars go to the prices of the players who are most in demand at each point in the auction. Since these are the higher-priced players at the beginning, when the most money is being spent, it makes sense that they would attract much of the extra money. Everyone wants these players and so they bid on them. The bidding goes up.
In my AL Only league, unlike your league, a lot of this extra money goes to the best available starting pitchers, who are in limited supply and are usually considered essential. The best hitters, not always as much, but each league is going to go about dealing with inflation in different ways.
Allocating the inflated funds by dollar value rather than inflation rate to player prices should help you better understand what’s going on during your auction.
So, instead of saying you have a 37-percent inflation rate, say you have $600 to add to the bid prices of the available players. Try this:
Start with your list of all players and their bid prices, which add up to the league budget. Usually, that is $3120.
Cross off the kept players.
Calculate the difference between the expected bid price of the kept players and their actual price. In our example, that’s $600.
Add that $600 in pieces to the available players’ bid prices you think will be most in demand during your auction. You don’t have to get this exactly right, you won’t get it exactly right, but once you have added that $600 in you’ll be in a better position to track your auction.
During the auction, keep track of whether the prices bid for the best players are more than you expected, less than, or about equal to. If players are going for more than you expected, you can stay away from them. Those players are being overbid and at some point, prices will come down and there will be bargains. If players are going for less than you expected, jump in. Cheap prices on the best players mean that at some point prices on lesser players are going to go up.
Which brings me back to your observation that the cheaper players aren’t taking inflation. That may be true in your league, or in your league last year but not always, as you’ll find out when you look at 2021-2022. The distribution of inflation on draft day isn’t always the same. Often it changes during the auction itself.
Sometimes you’ll notice about halfway through the auction, when there are very few highly desirable players available, that two teams still have more than half their budgets, while other teams have $40 for 13 players. When one team is in this position, with too much money, they can buy all the best remaining players, but they won’t usually be getting great deals because all the other teams will want to make one more splashy buy themselves. So each is ready to run the bidding up towards the expected price for the most desired players.
When two teams have too much money, they fight with each other as well as all the other teams. There are few bargains and often the most desired players left get bid up higher than anyone expected.
I don’t like to blow through my money early, but I don’t want to have the most money for the last half of the auction. Your goal has to be to pick off the best bargains all through the auction so that you’re able to most efficiently spend all your money.
Why do those teams end up with too much money halfway through? They’ll often say, there were no bargains early, and “I wasn’t going to pay those inflated prices!” But using inflated dollars to reset the expected bid prices lets you know that those prices weren’t really inflated.
For instance, what happens if Gunnar Henderson isn’t frozen. He’s a $26 player this year (I say). But his inflated price is more like $26 * 1.37 = $36. That’s even more reason for you to keep a $20 version, but let’s say everyone freaks out (“that’s too much!) and he goes for $32. Oops, there’s $4 more that gets added to the inflation pool. Having a good handle on the expected inflated price is a big advantage.
That $4 is money that’s going to be spent somewhere, or maybe not — when an owner leaves money on the table. Incorrectly accounting for draft inflation during the auction is the main reason teams leave substantial amounts of their budget on the table rather than spending it. In no way is that good.
By the way, this type of inflation can occur in any auction, even if there aren’t any keepers. Tracking the spending as it happens helps you avoid that mistake.
Share in the comments if you have any questions or observations about this. And kudos to Deficit Hawk for doing the math in his league. That will definitely give him an advantage.
GETTING DEFENSIVE
Rotoman:
I really liked your table on 2023 Defense Efficiency (see below). I was wondering if there is a website that projects 2024 Defense Efficiency based on current roster construction.

“DEF Jam”
Dear DJ:
FanGraphs has a projected DEF rating in its Steamer projections, where Ronald Acuña Jr. has a -8.1 (which represents dWAR, I think) and a FLD rating in their Team Depth Charts by Position, where Acuña Jr. has a -.4.
On the Team Depth Charts by Position page they show the members of the roster. In this case Right Field:

And a ranking of the teams at that position. This is the chart for Right Field:
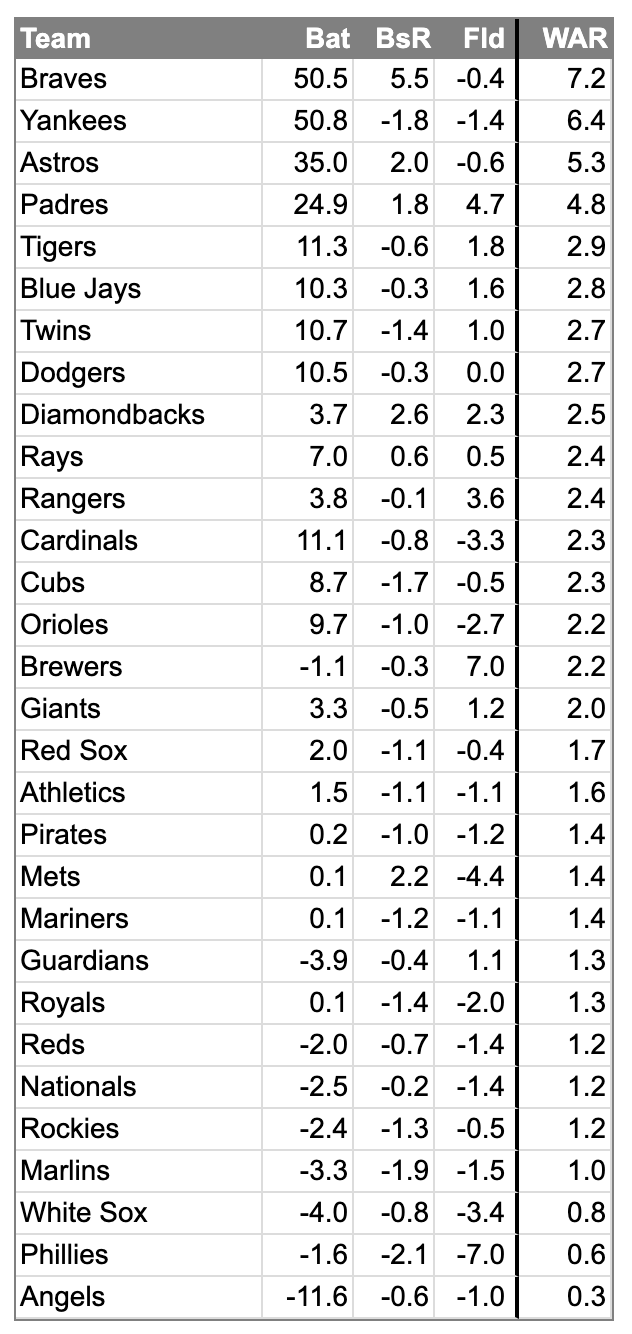
Hmmm. Here it is sorted by FLD, from best to worst:

I’m sure something can be made of this, but I think you have to careful.
The new defensive metrics do a good job of explaining what happened. Using probabilistic and other measures they can tell us who makes more good and bad plays on certain balls than others, which is important for understanding what has happened. Experts on these metrics say that in terms of defining actual talent, you really need to look at two years’ worth of results to have confidence.
That’s because most players make the regular plays most of the time, so we end up judging on the rarer, more difficult plays, of which there are fewer. One miscue by an excellent fielder has an outsized impact that time would have to erode.
A few years ago, I had an idea for how to add defense to fantasy baseball. FanGraphs ran a category of stats for a number of years, ending in 2019, called Inside Edge Fielding. The chart for Jorge Soler looks like this:

My idea was to add two categories weighted as a half each, so the two would make a sixth category in trad 5x5 leagues.
One would be a percentage of the Likely and Routine plays made for your players. These are the two categories on the right of the chart. Teams would be ranked by the percentage of the plays in these categories their players made.
The other would be a counting stat of the Impossible, Remote, and Unlikely plays made. Soler didn’t make any impossible or Remote plays, but he did make 11 percent of 26 Unlikely plays or three in total. Soler is not a DEF force.
Mike Trout, however, is:

The beauty of mixing a counting stat with a qualitative one is that it reduces the chances of gaming the stat by either adding or reducing volume.
Alas, integrating this data with a stat service proved to be impossible, and FanGraphs stopped buying it after 2019 (I assume Inside Edge is still collecting it for their clients), so for now the idea is impractical. Or impossible may be the better way to say it.
Thanks for the provocative question, DJ. If anyone knows of other DEF projections of any kind please pass them along in the comments.
FINAL WORD
Thanks for reading. If you like what’s going on here:
Links below for Subscribers Only:
Keep reading with a 7-day free trial
Subscribe to Rotoman's Guide to keep reading this post and get 7 days of free access to the full post archives.